
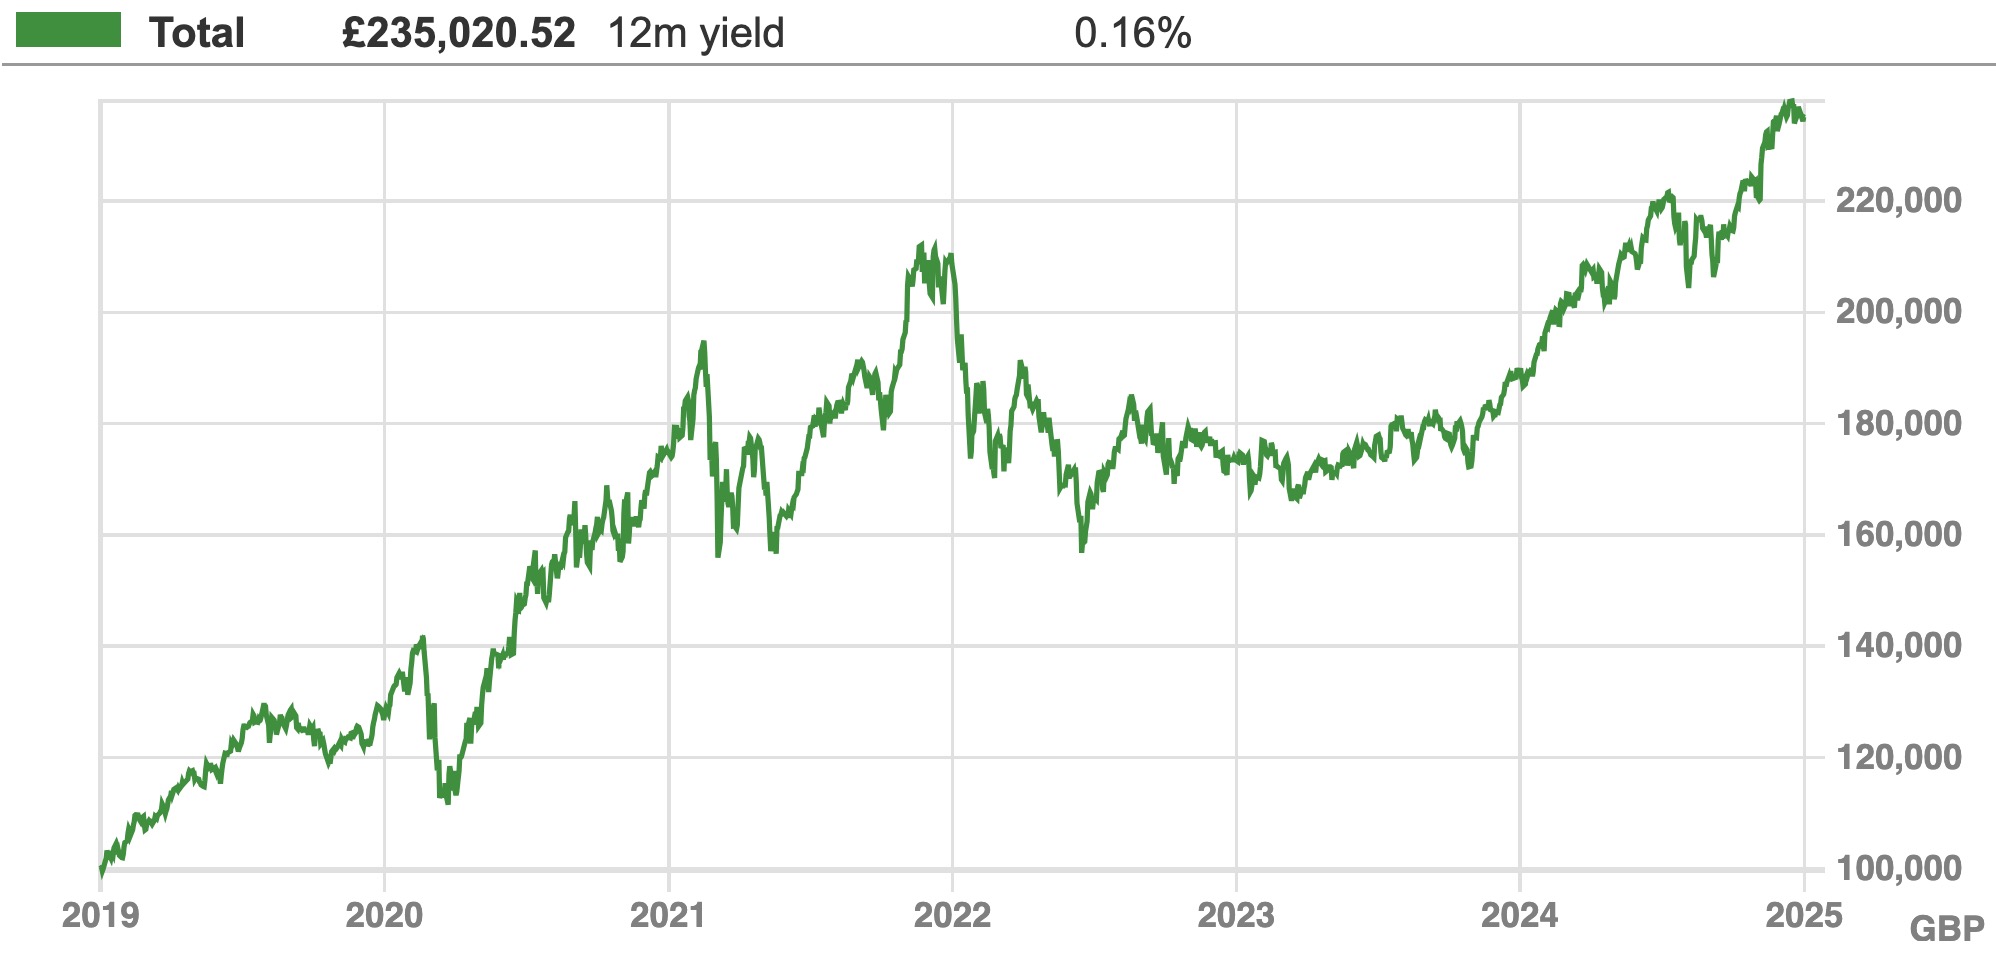
Fund Model Portfolio: £100,000 invested 2nd Jan 2019 to 31st December 2024
 Source: SharePad. Past performance is not a guide to future returns. See Disclaimer; Terms & Conditions.
The FH Model Portfolio is just a learning tool to see what works when it comes to fund investing.
The FH Model portfolio total return from 2019 to 2024 is 135% or 15.3% annualised. This compares to the SPDR MSCI ACWI ETF at 107% and 12.9% respectively.
2024 performance (total return)
Jan Feb March April May June July Aug Sept Oct Nov Dec YTD
FH +2.2% +4% +3.3% -1.9% +1.6% +6% -1.8% -0.8% 0.0% +2.9% +5.8% +0.6% +24%
2023 performance (total return)
Jan Feb March April May June July Aug Sept Oct Nov Dec YTD
FH -1.6% -0.5% +0.2% +1.2% +0.2% +2.9% +1.6% -0.1% -1.1% -2.8% +4.8% +4.5% +9.2%
2022 performance (total return)
| Jan | Feb | Mar | Apr | May | Jun | July | Aug | Sept | Oct | Nov | Dec | YTD | |
|---|---|---|---|---|---|---|---|---|---|---|---|---|---|
| FH | -11.4% | -3.8% | 7% | -5% | -5.6% | -3.5% | 6.6% | 1% | -2.2% | 3.5% | -1.3% | -2% | -16.8% |
| FT ASI | -0.3% | -0.5% | 1.3% | +0.3% | +0.7% | -6% | 4.4% | -1.7% | -5.9% | 3.1% | 7.1% | -1.4% | 0.3% |
| Relative | -11.7% | -3.3% | 5.7% | -5.3% | -6.3% | 2.5% | 2.2% | 2.7% | 3.7% | 0.4% | -8.4% | -0.6% | -17.1% |
2021 performance (total return)
| Jan | Feb | Mar | Apr | May | Jun | Jul | Aug | Sep | Oct | Nov | Dec | YTD | |
|---|---|---|---|---|---|---|---|---|---|---|---|---|---|
| FH | 1.2% | -3.7% | -3.1% | 6.3% | -6.6% | 8.3% | 2.1% | 5.1% | -3.4% | 5.9% | 6.7% | 0.3% | 19.3% |
| FTSE ASI | -0.8% | 2.0% | 4.0% | 4.3% | 1.1% | 0.2% | 0.5% | 2.7% | -1% | 1.8% | -2.2% | 4.7% | 18.3% |
| Relative | 2% | -5.7% | -7.1% | 2% | -7.7% | 8.1% | 1.6% | 2.4% | -2.4% | 4.1% | 8.9% | -4.4% | 1% |
2020 performance (total return)
| Jan | Feb | Mar | Apr | May | Jun | Jul | Aug | Sep | Oct | Nov | Dec | YTD | |
|---|---|---|---|---|---|---|---|---|---|---|---|---|---|
| FH | 3.58% | -6.11% | -4.61% | 8.40% | 7.73% | 8.1% | 0.4% | 8.4% | 0% | -4.1% | 6.2% | 6.2% | 38% |
| FTSE ASI | -3.25% | -8.89% | -15.07% | 4.92% | 3.42% | 1.54% | -3.59% | 2.4% | -1.7% | -3.8% | 12.7% | 3.9% | -9.8% |
| Relative | 6.83% | 2.78% | 10.46% | 3.48% | 4.31% | 6.56% | 3.99% | 6% | 1.7% | -0.3% | -6.5% | 2.3% | 47.8% |
2019 performance (total return)
| Jan | Feb | Mar | Apr | May | Jun | Jul | Aug | Sep | Oct | Nov | Dec | 2019 | |
|---|---|---|---|---|---|---|---|---|---|---|---|---|---|
| FH | 3.98% | 2.97% | 4.94% | 4.20% | 0.33% | 3.47% | 6.18% | -1.15% | -1.99% | -2.84% | 3.18% | 1.04% | 26.7% |
| FTSE ASI | 4.18% | 2.29% | 2.67% | 2.68% | -3.00% | 3.67% | 2% | -3.7% | 2.95% | -1.4% | 2.24% | 3.32% | 19.2% |
| Relative | -0.2% | 0.68% | 2.27% | 1.52% | 3.33% | -0.2% | 4.18% | 2.25% | -4.94% | -1.44% | 0.94% | -2.28% | 7.5% |
Portfolio and benchmark
Cash entered on 31 December 2018. Invested from 2 January 2019. Performance monitored in SharePad.
The model portfolio is theoretical. The main reason is that psychological biases hinder our performance when real money is on the line. Please see FAQs for further details.
FH Model portfolio objectives
FH Model portfolio objectives
The Fund Hunter Model Portfolio shows what I would do if I could only invest in funds. It assumed I had £100,000 at the start of 2019.
The objectives of this exercise are threefold. Firstly, to provide a learning tool that helps establish what works and what doesn't. A performance number helps focus the mind.
Secondly, it provides a level of accountability. If I issue a number of positive write-ups on a fund, it would be easy to ignore it if the performance is weak. If it is in the model portfolio, I will need to explain what went wrong.
Thirdly, the performance of the Model Portfolio should provide credibility to Fund Hunter. It is no use talking a great game if the numbers don't back you up.
There is sometimes a perception that funds deliver lacklustre returns (passive and active). Hopefully, the model portfolio can demonstrate otherwise.
Portfolio methodology
Portfolio methodology
Benchmark update: removal of benchmark
2022 highlighted how benchmarks can lead to strange results. A number of funds took significant risks to beat their benchmark and ended up crashing.
Fund investors do not need to beat any benchmark: they can own any benchmark through passive funds. Our objective is to avoid losing money and secondly to preserve capital in real terms.
Performance numbers, unfortunately, do not tell us anything about the risk that has been taken. Benchmarks create pressure to add value, which can result in excessive risk-taking.
The best investors appear to think in absolute return terms. Getting rid of a benchmark helps to achieve this and reduces the temptation to performance chase hot areas of the market.
The FH Model portfolio did not do particularly well in 2022. This may have been in part due to the pressure to 'beat a benchmark,' highlighting the harm they can do.
Benchmark: FTSE All-Share Total Return Index.
The All-Share Total Return Index has been chosen as the benchmark because it is what most UK investors try to outperform. Readers are welcome to use an alternative benchmark. The All-Share Total Return Index has one price for a day except when there has been an event such as a share split. The closing price on 31 December 2018 is the opening price on 2nd January 2019.
To buy into the All-Share Index someone would need to purchase an ETF or open-end fund that tracks the index. Both would have ongoing fees and a tracking error. Accordingly, a fund designed to track the All-Share Index will generate a slightly lower result.
Portfolio performance: includes bid/offer spread and stamp duty
The approach taken is to factor in costs that don't vary according to broker or the portfolio size. Costs that do vary according to portfolio size or platform are not factored in. This makes portfolio performance more comparable. Readers can factor in the "drag" that comes with their investment platform's costs and with portfolio size.
Bid/offer spread and stamp duty (included) - The portfolio takes into account the bid/offer spread and stamp duty when entering positions. They are unavoidable and don't vary according to the investment platform/broker used. Positions are bought at the "ask" price and the portfolio is valued on the "bid" price.
Trading costs (excluded) - These vary by investment platform/broker and according to portfolio size. Hargreaves Lansdown doesn't charge a commission for buying into an open-end fund, for example, while most platforms do. For a modest to large portfolio, the trading costs are not likely to be significant. This is because the charge for a trade is typically a flat fee (i.e. £10).
Platform fees (excluded) - These vary by investment platform/broker and according to portfolio size. They are also in place if you buy an All-Share tracker. Accordingly, they won't have an impact on the relative performance of the portfolio versus an All-Share tracker.
Valuation - SharePad calculates the valuation for the portfolio using the bid price for ETFs and the latest open-end fund price. Open-end fund prices are a day out of date because today's realized selling price will be published a day later.
Summary - The skew between the real return on an All-Share total return tracker and the portfolio is the exclusion of commission for buying and selling funds. Both will incur investment platform fees. The commission for buying the All-Share total return fund only occurs when it is bought. The Fund Hunter portfolio has trading commission over time. However, trading commission is relatively low on funds and so the overall impact is not likely to be significant.
Initial investment
Initial investment
31th December 2018 - £100,000 entered into SharePad. This allows both the initial portfolio and the All-Share Total Return index to start at 100,000.
2nd January 2019 - £100,000 invested between 3pm and 3.30pm. Time chosen because Exchange Traded Funds tracking the US market have more liquidity and lower spreads when the US market is open.
ETFs - These are invested in straight away at the asking prices shown.
Open-end Funds - To space out the initial investment, the open-end funds were invested two days after the market traded funds on 4 January (before midday).